Risk of Late-Season Nitrogen Deficiency
Click the map to select your location. |
|
Or zoom in by selecting your county from the menu on the right. |
|
The blue marker shows your selected location. The red dot shows the nearest weather center to the selected location which is present in the database. |
|
- Engage farmers and agronomists in the participatory learning and educate them about the complex impact of rainfall, management, and cropping system on the risk of the-end-of season corn N deficiency.
- Conduct “what-if scenarios” analysis to estimate the risk of specific farmer practices to be deficient given the field management, different N rates, and observed, historical or projected spring rainfall.
- Enhance 4R (right rate, timing, form and method) education using large-scale data from production fields over a long period of time.
- Select your area of interest by clicking on your county using the map in the left navigation panel or selecting it from the dropdown menu.
- Select your crop rotation in the left navigation panel: corn after corn or corn after soybean.
- Click on the “Risk based on Rainfall” tab, and in the left navigation panel enter Nitrogen Rate (lbs) using either the Slider widget or the ‘Manual N Rate:’ input box.
- Select the boxes in the “Management Practices” column. Multiple management practices can be selected.
- Review the output probability graph, paying particular attention to where the “Current Cumulative May through June Rainfall” vertical line crosses the probability line(s) for each management practice(s). The color legend on the vertical axis of the graph indicate the nitrogen deficiency risk categories: dark red, “Very High”; red, “High”, light red, “Moderate”, pink, “Low”, yellow, “Very Low”. The dark and light blue vertical bands show, respectively, the range of historical rainfall in 50% and 90% of years.
- Check the “Contextual Information” below the graph. The probability numbers from Step 5 are shown in the Table and indicate risk categories of N deficiency. Change the N rate to see how the risk probability changes.
- Click on the “Risk based on Nitrogen Rate” tab. See how the probability changes when the N rate is higher or lower by 15 or 20 lbs N/acre from your original Nitrogen application rate. Probabilities for the observed rainfall are shown by a red line; median historical rainfall for your location are symbolized by a blue line. The light blue band shows the range of rainfall in 50% of historical years.
- Check the “Contextual Information” below the graph. The probability numbers from Step 7 are shown in the Table and indicate the risk category.
- Click the “Rainfall Maps” tab. This tab contains two maps: Cumulative May through June rainfall for the current year (upper) and the deviation from the historical rainfall averages (lower). If the tool is used between May and June, the cumulative daily rainfall will be calculated until the current date.
- Select another location or different county to check how probability value change.
- Read “Introduction” to gain more information about background, data, methodology and examples from using the on-line tool.
Every year farmers play a game of risk with N management. One type of agronomic or production risk occurs when a corn field becomes deficient in N fertilizer and yield is lost. Quantifying this agronomic risk for a specific field is difficult because outcomes are dependent upon many factors. Indeed, farmers across Iowa use several N management practices that differ in N forms—several commercial types in addition to animal manure, with different timing and application methods, and of course, different rates of N across several landform regions with differing rainfall patterns and at least two common cropping systems.
Our research indicates that spring rainfall is a primary risk factor for N loss and deficient corn N status, but early and mid-summer rainfall could prevent post-spring application of N and, therefore, is a secondary risk factor should a grower delay N application. The Iowa average (1893 – 2014) May-June (spring) and July-August (summer) rainfall are similar with slightly more rainfall in the spring (8.5”) than in summer (7.4”). A climate risk context is given by separating the data into the current climate normal period (1981 – current) and past period (1893 – 1980). Spring and summer rainfall are uncorrelated in Iowa (Figure 1). Using the fact that spring and summer rainfall are independent, we identify rare years with the 95th percentile. Prior to 1981, only seven years fall outside the 95th percentile but in the 35 years since 1981 this has happened in 11 years (32%).
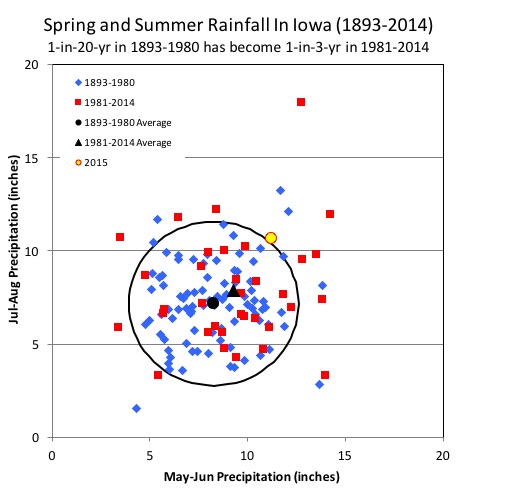
Change in excessive rainfall has implications for N risk management. Growers should know the risk for loss of N from their fields (Figure 1). The 11 extreme years identified in 1981 - 2014 can be grouped by whether the extreme rainfall occurred in the spring, summer, or both. Years with extremely high rainfall in the spring (4 of 11 years) would imply higher risk for N loss from pre-spring application. Years with extremely high rainfall in the summer (3 of 11 years) would imply the risk of inability to get into the field to apply post-spring N. Finally, years with extremely high rainfall in both spring and summer (4 of 11 years) would imply risk to both management approaches.
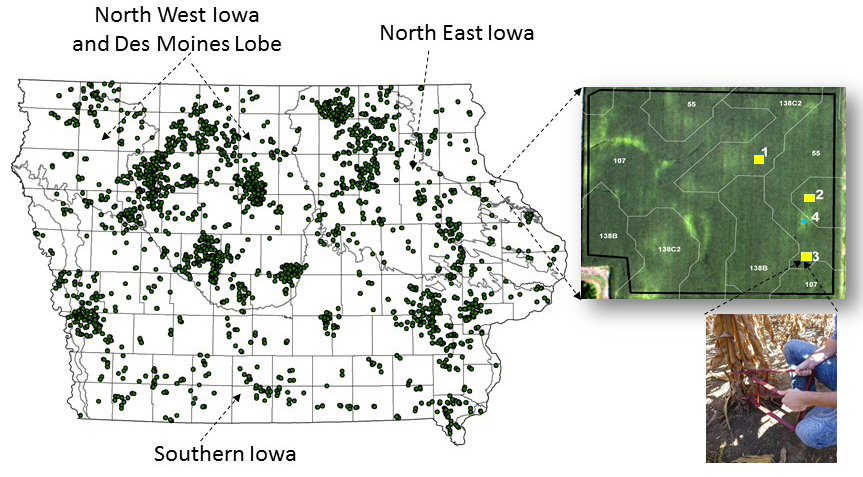
The Iowa Soybean Association On-Farm Network and Environmental Programs & Services teams have been tracking effects of rainfall on corn N management using late-season aerial imagery and corn stalk nitrate surveys since 2006. When data of yield response to N are not available or difficult to collect, the annual survey based on the late-season corn stalk nitrate test guided by the aerial imagery of the corn canopy provide important post-season feedback information. Farmer participation in annual feedback surveys is as critical as going through an annual medical check-up.
|
Data collected by agronomists and farmers from more than 3,500 corn fields across Iowa between 2006 and 2014 were used to develop equations describing the relationship between rainfall, N rate and management This analysis enables researches to estimate the risk to a specific field of experiencing deficient status N by the end of the season (more detailed in a manuscript “Integrating Field and Climate Data for N Risk Management”). The data collected over the last 10 years indicate that different management practices, a combination of timing and N form, will require slightly different N rates for achieving optimal corn N status (Figure 3). The distribution of N rates shown as box plots in Figure 3 indicate that the spring and sidedress applications require slightly lower rates that those in the fall. Also, the variability in N rates needed to produce the optimal N status with fall-injected swine manure applications are slightly higher than that with commercial N sources such as UAN and AA. It can be noticed also that a range of rates for SD N (UAN or AA) and Spring UAN for both corn after corn and corn after soybean are in the same ballpark as those produced by the Iowa State University N Calculator. The value of the ISA data, however, is that inferences about other practices such as Fall AA and Spring AA can be made. |
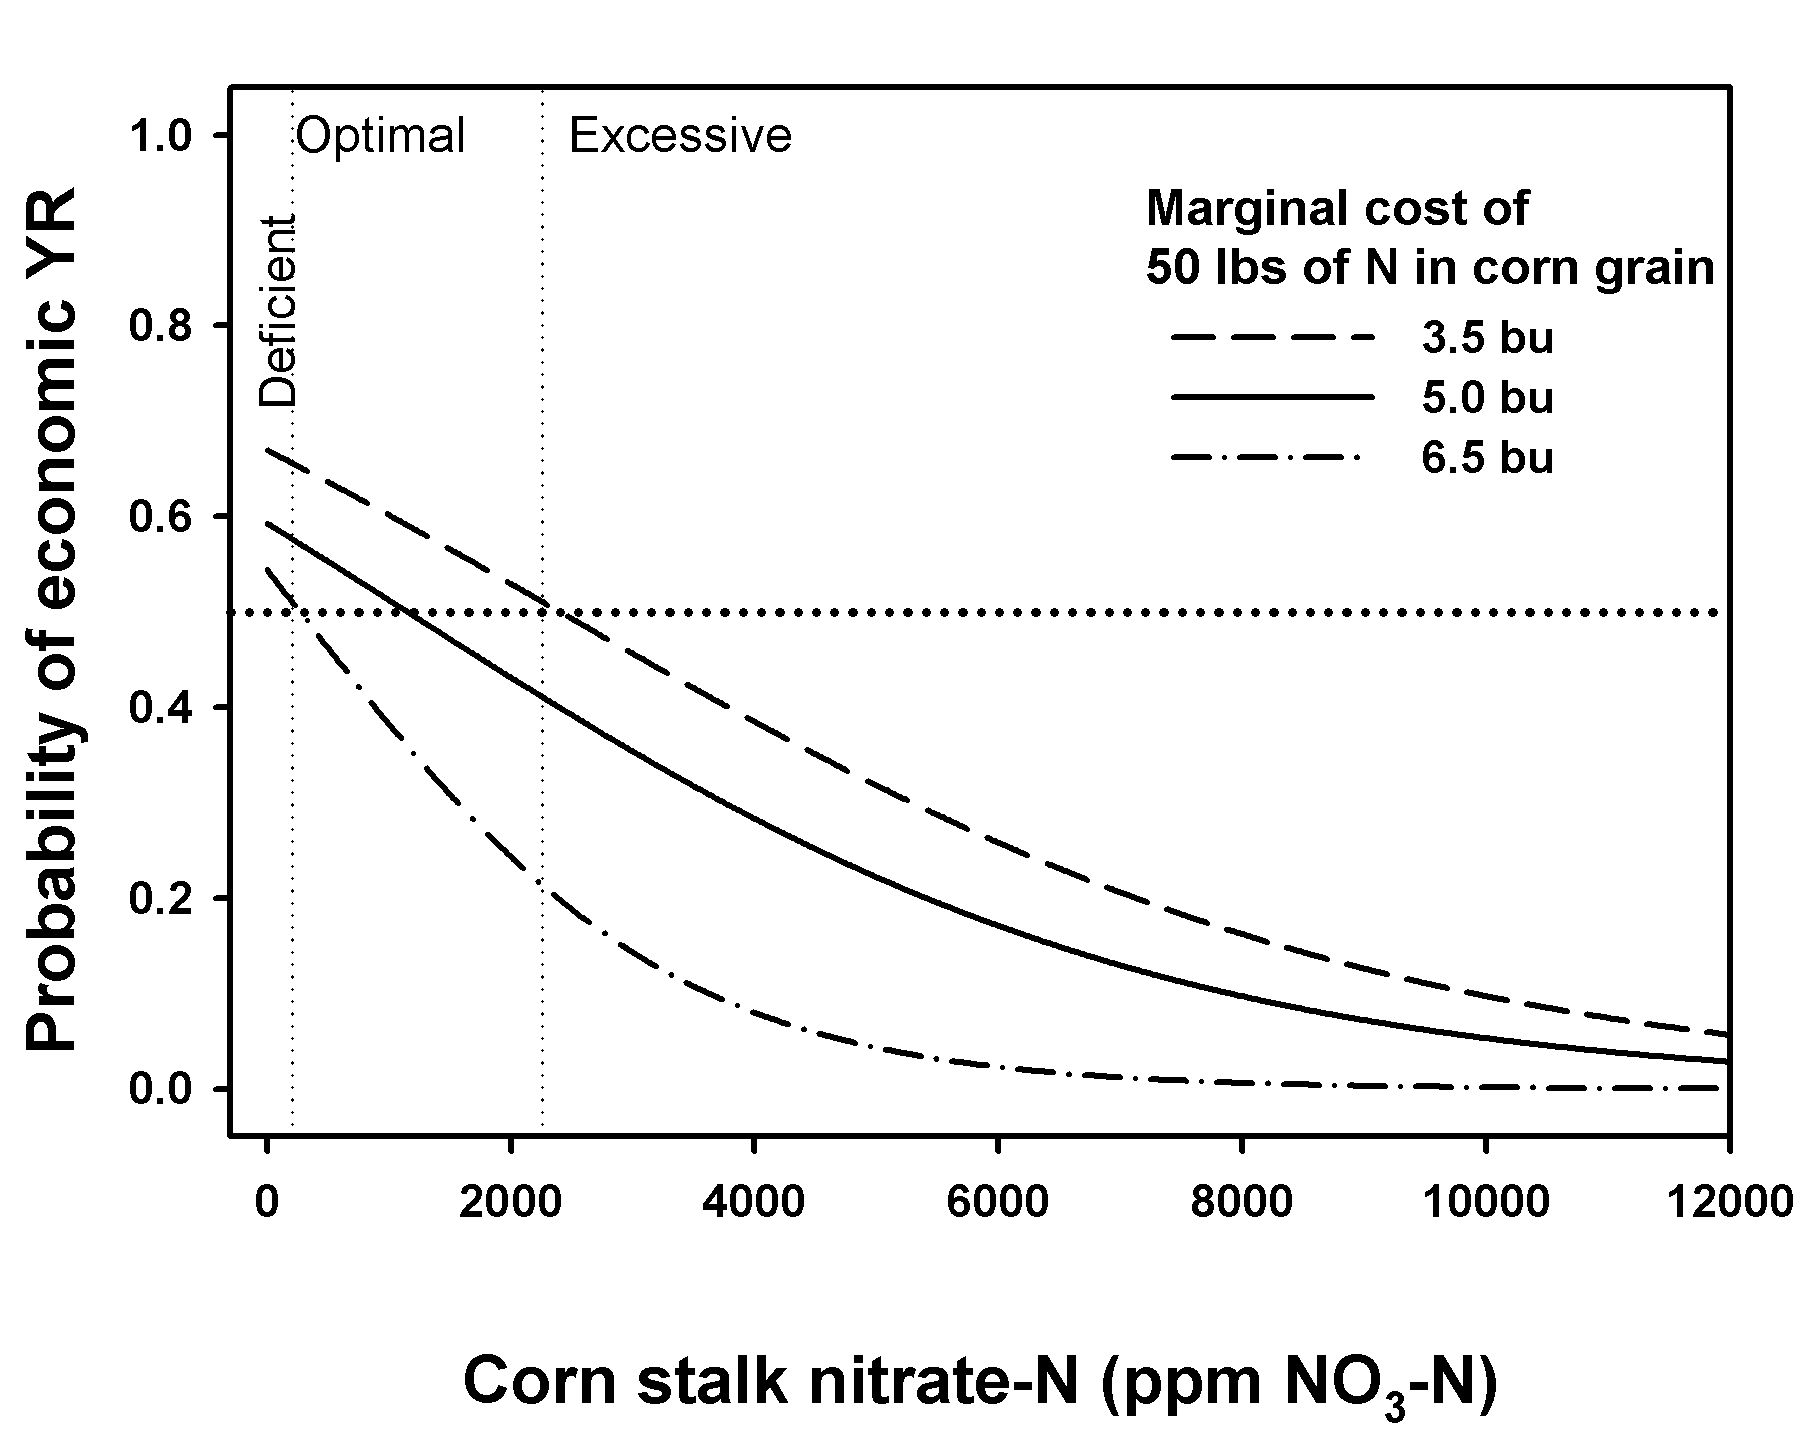
The deficient N status suggests that the supply of N from the soil and fertilizer was likely not adequate, and plants will likely respond to additional N with above break-even yield response. The optimal N status suggests that the supply of N from the soil and fertilizer matched plant demand, and additional N will produce above break-even yield response less than 50% of the time. The excessive N status suggests that the supply of N from the soil and fertilizer exceeded plant demand, and additional fertilizer will not increase yield response. |
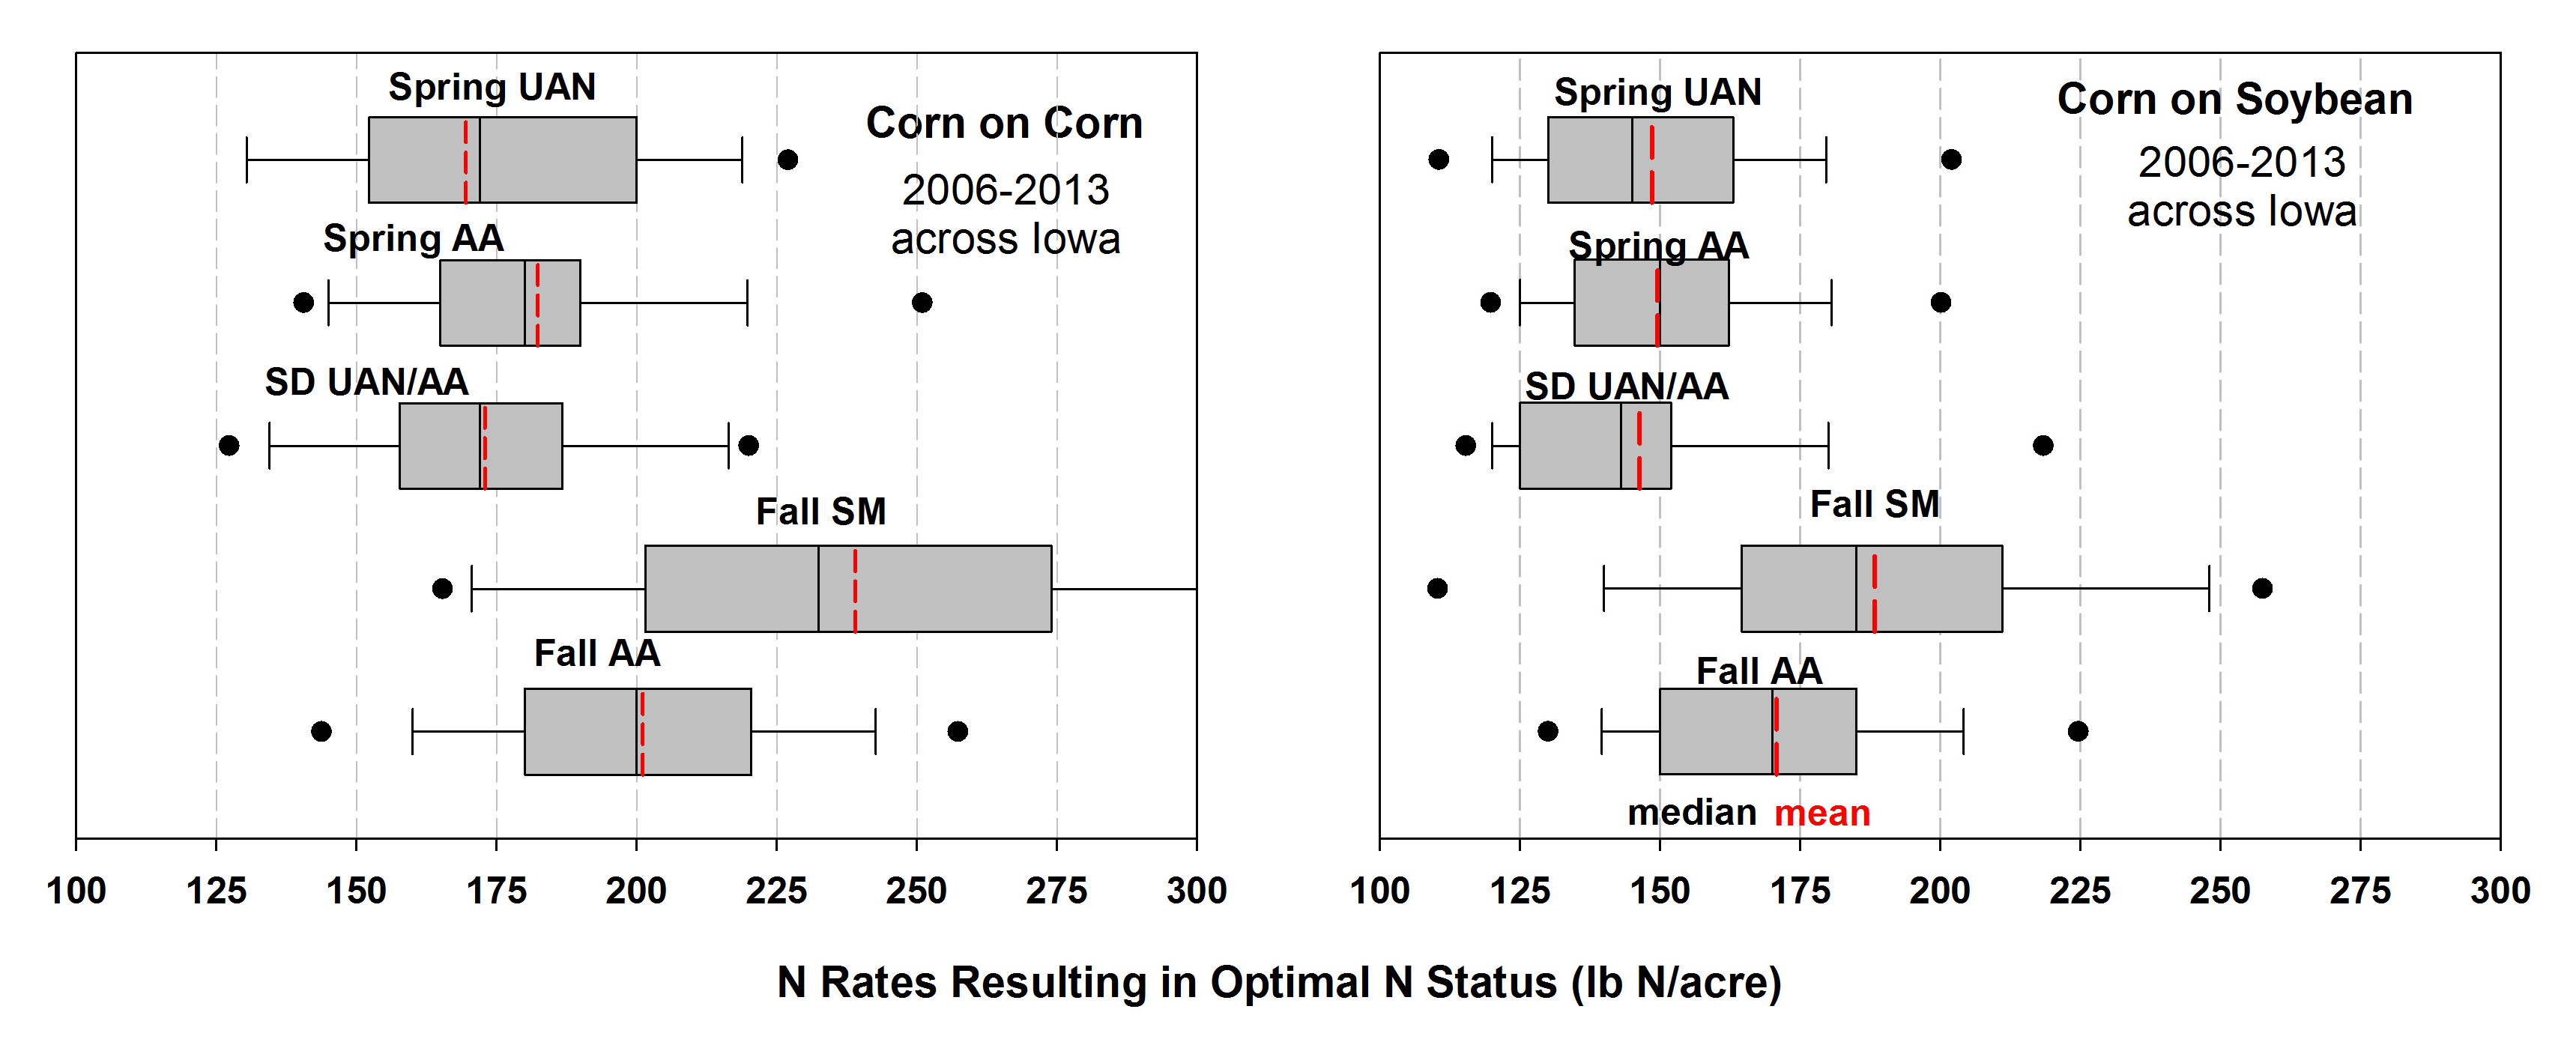
- Fall AA: fall-applied anhydrous ammonia
- Fall SM: fall-injected swine manure
- SD UAN/UAN: sidedress urea ammonium nitrate solution or anhydrous ammonia
- Spring AA: spring-applied anhydrous ammonia
- Spring UAN=spring-applied UAN
For the risk neutral farmers vthose who ignore the risk and do not want to gamble, the data in Figure 2 would be enough to guide their N management. These farmers will ignore the effect spring rainfall and other factors.
For risk-averse and risk-tolerant farmers the N calculator should help quantify the risk of being deficient for a range of rainfall, N rates, management and cropping system scenarios. The value of the risk calculator to the risk-averse or risk-taker farmer is shown in Table 1.
Example from Southern Iowa
| Total rate, lb N /acre |
May through June rainfall, inches | ||||
|---|---|---|---|---|---|
| 10 (normal) | 13 | 16 | 19 | 22 | |
| Fall Anhydrous Ammonia | |||||
| 130 | 0.39 | 0.50 | 0.60 | 0.67 | 0.75 |
| 150 | 0.36 | 0.46 | 0.56 | 0.65 | 0.72 |
| 160 | 0.35 | 0.44 | 0.55 | 0.64 | 0.71 |
| Fall Injected Swine Manure | |||||
| 130 | 0.42 | 0.52 | 0.62 | 0.70 | 0.77 |
| 150 | 0.39 | 0.49 | 0.59 | 0.78 | 0.75 |
| 160 | 0.37 | 0.47 | 0.57 | 0.65 | 0.73 |
| Sidedress UAN or Anhydrous Ammonia | |||||
| 130 | 0.55 | 0.65 | 0.73 | 0.80 | 0.85 |
| 150 | 0.52 | 0.63 | 0.71 | 0.78 | 0.84 |
| 160 | 0.51 | 0.61 | 0.70 | 0.77 | 0.82 |
| Spring Anhydrous Ammonia | |||||
| 130 | 0.26 | 0.35 | 0.44 | 0.53 | 0.62 |
| 150 | 0.24 | 0.32 | 0.41 | 0.50 | 0.59 |
| 160 | 0.23 | 0.30 | 0.39 | 0.48 | 0.57 |
| Spring UAN | |||||
| 130 | 0.43 | 0.53 | 0.63 | 0.71 | 0.77 |
| 150 | 0.40 | 0.50 | 0.60 | 0.68 | 0.75 |
| 160 | 0.38 | 0.48 | 0.58 | 0.66 | 0.73 |
Aggregated data of annual N status surveys clearly shows a greater probability of N deficiency with each additional inch of May through June rainfall, which has a much larger impact (ten to 16 times greater) on N deficiency than an additional pound of N fertilizer. Simply put, both rainfall and N rates impact the likelihood of N deficiency but these effects are in different directions, with the overwhelming impact being from early season rainfall (Table 1, representing southern Iowa). The data in Table 1 also clearly shows that, in general, starting with more N does not rapidly decrease risk values.
As shown in Table 1, when all other factors are equal and the total N rates used by farmers range from 130 to 160 lb N/acre, corn after soybean fields in the Southern Iowa with 13 inches of May-June rainfall will have a 26 to 60 % chance of late-season N deficiency; with 16 inches, a 40-70 %; and with 19 inches, a 50-80 % chance of N deficiency.
Based on historical data, fields in the southern Iowa that received Spring AA may have about 15-30% less chance to be deficient than other form and timing combinations.
The online calculator estimates clearly indicate the higher risk of deficient corn N status for fields for corn after soybean compared to corn after corn. While this survey does not allow us to draw a clear cause and effect relationship, other studies suggest that it is likely that corn after soybean fields lose more N (references) than corn after soybean. These differences are likely because soybean residue have a lower C-to-N ratio and mineralize much faster that corn residues. It is also likely that some fields with corn on corn have a longer history of manure applications, and therefore, higher yield potential and demand for this nutrient.
Similar to other N diagnostic tools, the stalk nitrate test outcomes can be variable. The data collected between 2006 and 2010 from on-farm replicated strip trials with two N fertilizer rates (Agronomy Journal, 2012, 104:1284–1294) indicate the change of receiving above break-even yield response to the application of an extra 50 lb N/acre when the stalk nitrate test is deficient is between 55 -75%. This probability is about 30-60 % when the stalk nitrate test is optimal and less than 30% when stalk nitrate test shows the excessive stalk nitrate value of larger than 6000 ppm. The false positive (when the test suggest deficient status when it is truly not) can arise when corn plants exactly use up all N at the time of physiological maturity thus maximizing yield, so that additional N would not produce economic response.
The information contained in this website is for information purposes only. The information is provided by the Iowa Soybean Association and while we endeavor to keep the information up to date and correct, we make no representations or warranties of any kind, express or implied, about the completeness, accuracy, reliability, suitability or availability with respect to the website or the information, products, services, or related graphics contained on the website for any purpose. Any reliance you place on such information is therefore strictly at your own risk.
In no event will we be liable for any loss or damage including without limitation, indirect or consequential loss or damage, or any loss or damage whatsoever arising from loss of data or profits arising out of, or in connection with, the use of this website.
Through this website you are able to link to other websites which are not under the control of the Iowa Soybean Association. We have no control over the nature, content and availability of those sites. The inclusion of any links does not necessarily imply a recommendation or endorse the views expressed within them.
Every effort is made to keep the website up and running smoothly. However, the Iowa Soybean Association takes no responsibility for, and will not be liable for, the website being temporarily unavailable due to technical issues beyond our control.
What we collect
This website may collect and store some of the information you provide, including:
- Browser characteristics (screen size, settings)
- Device characteristics (Android, iOS, Windows, Mac)
- Use of interactive site elements, including user-provided information, such as location on a map.
- Server requests (this may include, for instance, IP addresses, dates, and times of access)
We do not store any information collected via the use of cookies. We also do not provide any information to third parties.
What we do with the information we gather
The information we collect helps us to create better tools for you to use:
- Device characteristics help us to develop new apps which are more compatible with devices used to access our tools
- Browser characteristics help us tailor website design to typical use. In addition, we can test our tools on the same software you use, leading to more reliable site performance.
- Use of interactive elements helps us to understand which features are of the most interest, and may help us to identify which site features are difficult to use.
- Server requests may be kept for debugging purposes.
Contextual Information
Reading this Graph
Risk Table
Contextual Information
Reading this Graph
Risk Table
Explanation
The first map shows average historical rainfall in May and June, computed for 4km x 4km regions within the state, between 1997 and 2017. In May and June, this historical rainfall is cumulative over the period between May 1 and today, otherwise, the map shows the full cumulative rainfall during both May and June.
The second map shows the deviation from the historical average rainfall for each region. In May and June, this map will update daily, and rainfall totals should include all but the last 24-48 hours. Otherwise, the map shows the most recent May-June period.
All rainfall totals are gathered from Iowa Environmental Mesonet .
References:
- Anderson C.J. and P.M. Kyveryga. 2016. Integrating Field and Climate Data for Nitrogen Risk Management. Climate Risk Management (in review).
- Kyveryga, P., P. Reeg, T. Mueller and C. Anderson. 2014. Incorporating risk into 4R Nutrient Management. p. 132-141. In Proc. Annu. Integrated Crop Manage. Conf., 26th, Iowa State Univ., Ames, IA. 3-4 Dec. 2014.
- Kyveryga, P.M and T.M. Blackmer. 2013. 4R Management. Differentiating Nitrogen Management Categories on Corn in Iowa. Better Crops with Plant Food, 97 (1), 4-6.
- Kyveryga, P.M. and T. M. Blackmer. 2012. On-Farm Evaluations to Calibrate Tools for Estimating Late-Season Nitrogen Status of Corn. Agronomy Journal 104:1284–1294.
- Kyveryga, P.M., T.M. Blackmer, R. Pearson, and T.F. Morris. 2011. Late-season digital aerial imagery and stalk nitrate testing to estimate the percentage of areas with different N status within fields. Journal of Soil and Water Conservation. 66(6)373-385.
- Kyveryga, P.M., H. Tao, T.F. Morris, and T.M. Blackmer. 2010. Identification of nitrogen management categories by corn stalk nitrate sampling guided by aerial imagery. Agronomy Journal 102:858-866.
- Kyveryga, P.M., T.M. Blackmer, and R. Pearson. 2011. Normalization of uncalibrated late-season digital aerial imagery for evaluating corn nitrogen status. Precision Agriculture. DOI: 10.1007/s11119-011-9231-8
Sponsored by:
Iowa Soybean Association

On-Farm Network

Environmental Programs & Services

Partially Funded By:
Integrated Farm Livestock Management Project from the Soil Conservation Division of the Iowa Department of Agriculture and Land Stewardship


USDA Natural Resource Conservation Service through Conservation Innovation Grants
Informed By:
Iowa Environmental Mesonet
This applet uses aggregate climate information as well as GIS data to provide rainfall estimates for specific locations.
Developers:
- Dr. Susan Vanderplas
- Dr. Chris Anderson, Iowa State University
- Iowa Soybean Team
Acknowledgement:
We are very thankful to all farmers, agronomists, technical service provides, partner industry professionals and university scientists who participated and contributed to the on-farm field and environmental studies used to develop this tool.